 by
by Index
Introduction
When we embark on Deep Learning, we are inevitably confronted with a difficulty of understanding in relation to the very concept of neural network but also in relation to its configuration. Indeed, it is difficult to fully understand each adjustment lever of such a mechanism which seems so abstract!
Personally, I have always found the idea that we can model almost anything with such a seemingly simple system (from a unitary, neuronal point of view) magical. But what is the real impact on the whole system if:
- We add hidden layers & neurons on a particular layer
- The learning rate changes
- We change the number of epochs or cycle of propagation-back-propagation
- The activation functions changes
- Regulation functions are used
- We change the size of the batches
- etc.
Tensorflow Playground
Of course we can use Tensorboard (for those who use Google API and not another like PyTorch). But that would mean taking time to do lots of testing and see how it looks. Instead, a team (launched by Daniel Smilkov & Shan Carter) created a brilliant educational tool that allows you to test a whole set of possible configurations in just a few clicks and especially to see their results live: Tensorflow Playground . This tool is a web tool based on javascript and d3.js.
You will now see in a concrete and graphic way the changes of the main configuration of your neural network. Of course This tool does not allow you to design any type of neural network. It is actually limited in this area because you can only create sequential networks, but in terms of learning I find the approach to be really very fun. So let’s go ?
You can download and install this tool directly through Github or go to a ready-made instance here . Of course we will first use the online version and play around with it to better understand neural networks.
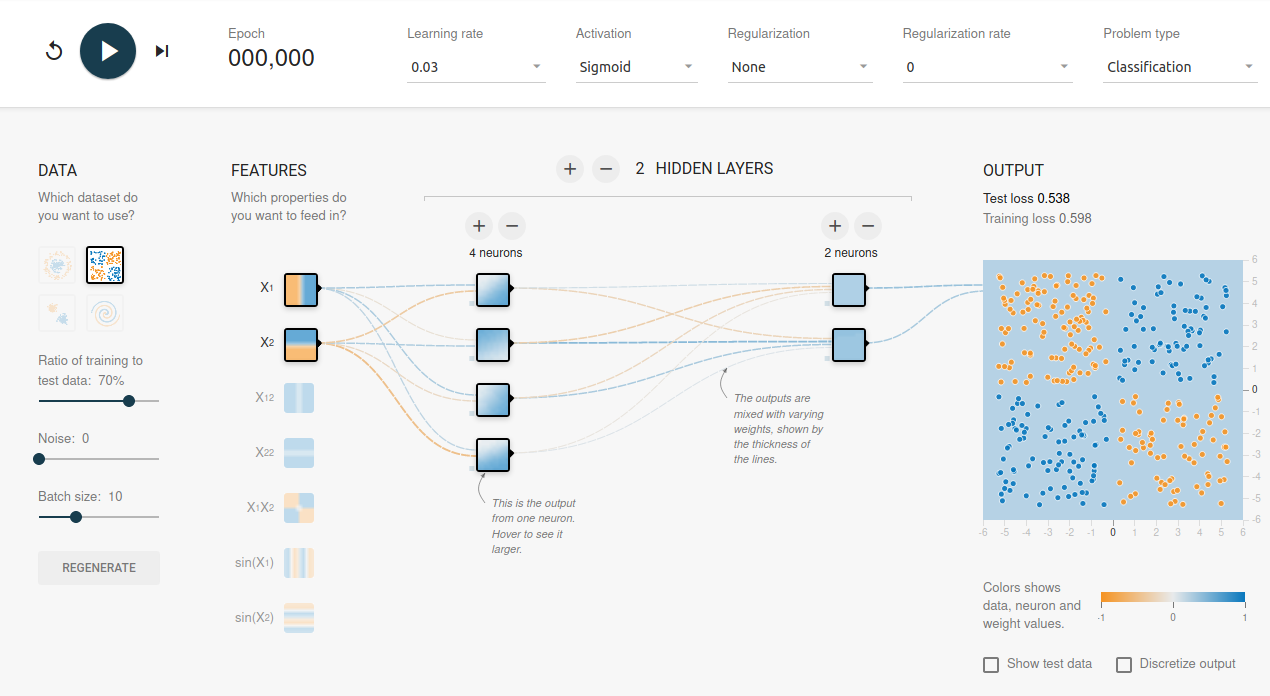
Interface presentation
The interface is rather simple and uncluttered, let’s detail it by part.
The upper strip allows you:

- To start learning or to reset it
- Owe the number of epochs performed (once we have started learning)
- View the learning rate (for gradient descent)
- See the activation functions of our neurons
- View the regularization functions (only L1 & L2)
- Change the type of problem (is it a classification or a regularization problem?)
Then we have the neural network inputs:
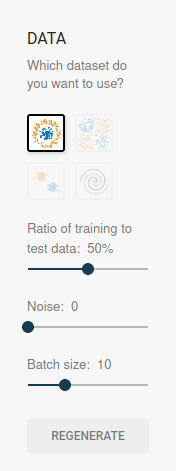
- We can choose the type of data distribution
- The ratio of training data to test data.
- Add outliers (noises) in order to disrupt the learning of the network a little by inserting more realistic data.
- The size of the neural network learning batches.
Note: Orange points have a value of -1 while blue points have a value of +1
We then have the output:
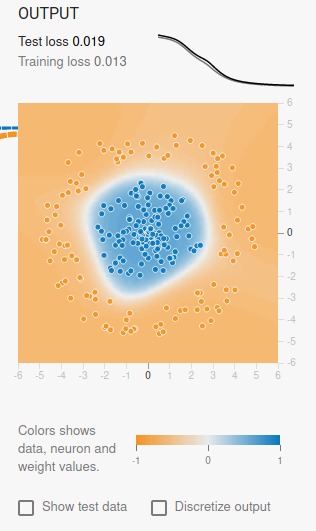
The output graph shows the result of the neural network. What is particularly interesting at this level is that we have above the result the curves of the cost functions (loss) by epoch (epochs). This is one of the most important things to watch out for when you go to start learning to see if your network is performing or not. The training cost curve is gray while the test one is black.
Most interesting (for the end) maintaining the network design graphically in the middle:
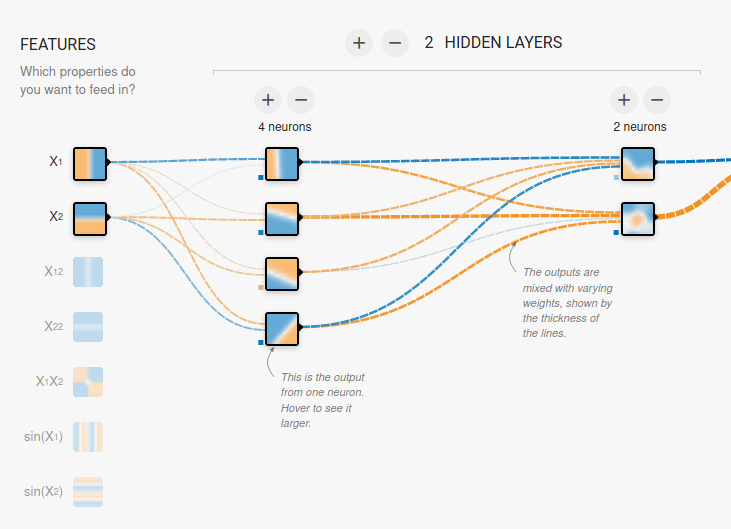
The network is presented of course by vertical layers. You can add up to 8 hidden layers by clicking on the + (or removing it with the -). On each layer you can also add or remove neurons with the + and – above the layers.
What to note here (once you have started your learning):
- You will see by neuron how on this stage the result begins to materialize. You will notice that the more layers you add the more the network refines its result: by roughing in the first hidden layers to do more specialized work in the last ones.
- Hover the mouse over the links between the neurons, you can also see the weight values and why not detect dead neurons for example. The thickness of the line also gives you an indication of the importance of the weight.
Some tests
We’re ready to go for a few tries now. Try it out several times, changing parameter by parameter to see its impact. Look particularly at the cost curves, it is necessary of course that they are as low as possible together. Be careful that it does not diverge, which would mean that you are for example over-learning (training curve at the bottom and test curve higher).
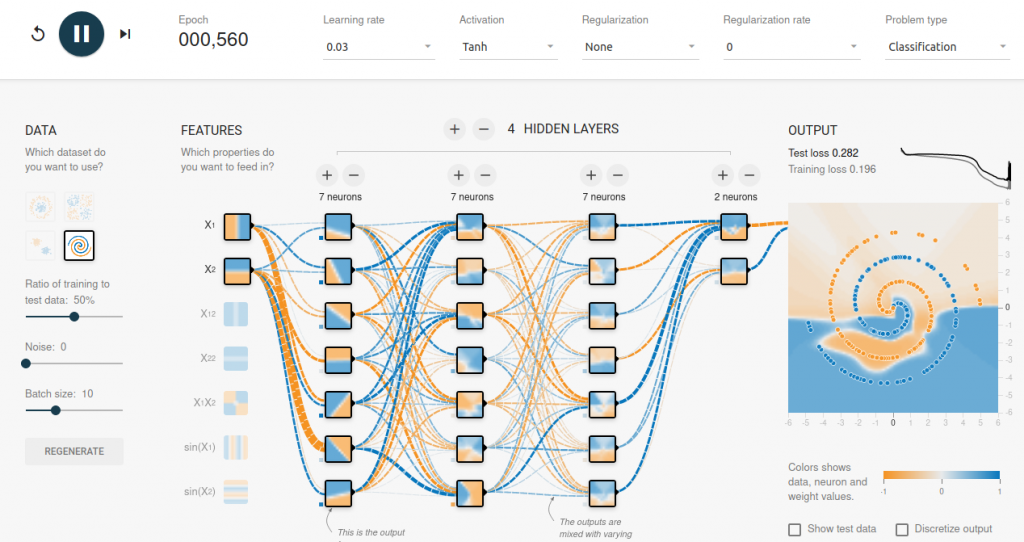
To go more law and for example detect a disappearance of gradient, try the distribution of the data in the form of a spiral:
You will already see that the training really takes a lot longer. It will undoubtedly be very unstable insofar as it will sometimes have stagnation (plateaus) then recovery, etc. If you have put more than 3 hidden layers, also notice the evolution of the weights on the layers on the left compared to those on the right.
Conclusion
This tool is above all a fun tool but it really allows you to feel the importance of the major adjustment levers of a neural network. So if you are embarking on this Deep Learning adventure I highly recommend that you play with this simulator.