
 by
by You like Tableau, but above all you would like to encapsulate your analyzes or Dashboards in your own portal or application. It’s pretty easy to do as long as you use the right API (provided by Tableau ).
To get started, go to the website of Tableau : https://onlinehelp.tableau.com/current/api/js_api/en-us/JavaScriptAPI/js_api.htm
Everything is there … from the tutorial to the help (via the API reference). In short, it is the essential place that you have to go and see first. Moreover, this article has no ambition to replace this link but rather to quickly show how to obtain a result.
You are not an expert in Javascript? that’s okay… follow the guide and you’ll see how easy it is to use this API.
Index
Before you start!
Use the right API
Before thinking of encapsulating a Dashboard, it must of course exist! and more particularly that it is deployed on a server. So we have at least three possibilities:
- The Dashboard is published on Tableau Public
- The Dashboard is published on Tableau Online
- Or you have your own server (on-premise)
Depending on the server on which your Dashboard you will need to use a different JavaScript API. Here are the Javascripts calls that you will need to include depending on your use case:
With a Tableau On Premise server:
<script src="https://serveur_on_premise/javascripts/api/tableau-2.min.js"></script>
With a server Tableau Online:
<script src="https://online.tableau.com/javascripts/api/tableau-2.min.js"></script>
With a Tableau Public server:
<script src="https://public.tableau.com/javascripts/api/tableau-2.min.js"></script>
Everything will therefore happen via calls to the JavaScript API. So don’t try to create IFRAMEs! instead we will include in our html page DIV tags that will interoperate with the API code Tableau .
Get the URL of your dashboard
You must indeed retrieve the URL of your viz or Dashboard. To do this, I advise you to use the Share function which allows you to copy / paste the right link directly (see below):
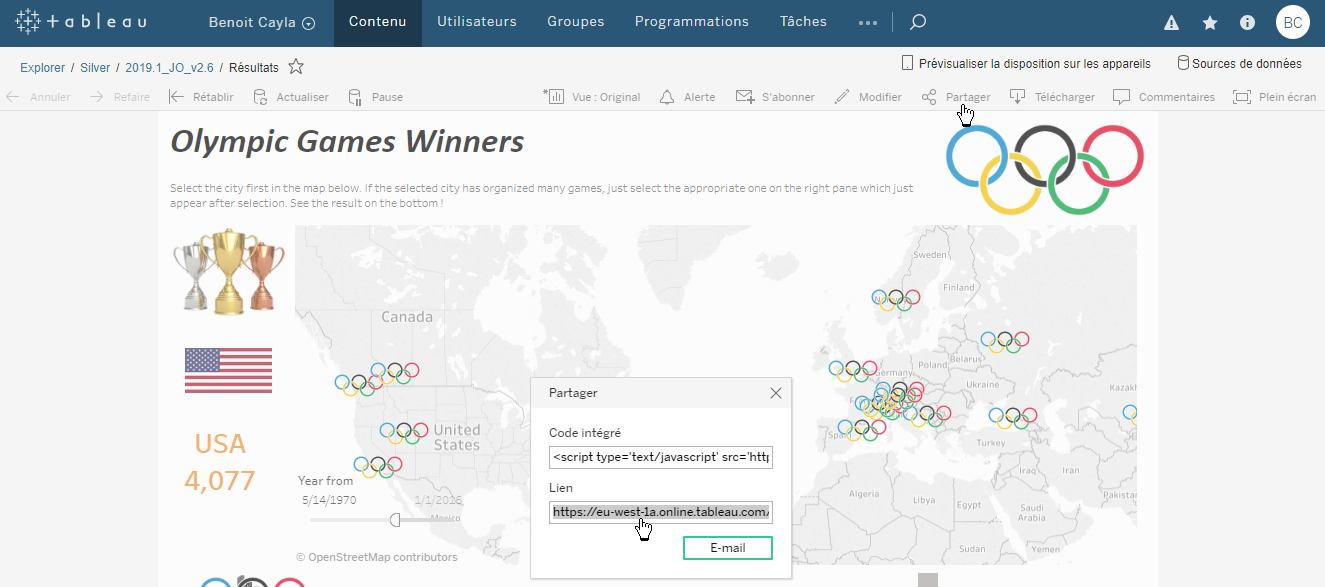
Here you are ready!
Step 1: Encapsulate in the simplest device
Now let’s edit the code of the HTML page in which you want to encapsulate your Dashboard. Here I will take a blank page so as not to pollute the code with an external site.
<!DOCTYPE html>
<html>

<head>
    <!-- a utiliser dans Tableau Online -->
	<script src="https://online.tableau.com/javascripts/api/tableau-2.min.js"></script>
    <script>
        var viz,workbook, activeSheet;

		function initViz() {
			myurl="https://eu-west-1a.online.tableau.com/t/benoitcayla/views/2019_1_JO_v2_6/Rsultats?iframeSizedToWindow=true&:embed=y&:showAppBanner=false&:display_count=no&:showVizHome=no";
            var containerDiv = document.getElementById("vizContainer"),
                url = myurl,
                options = {
                    hideTabs: true,
					hideToolbar: true
                };
            viz = new tableau.Viz(containerDiv, url, options);
        }
    </script>
</head>

<body onload="initViz();">
    <div id="vizContainer" style="width:800px; height:860px;"></div>
</body>

</html>
You see the code is really simplistic:
- I have of course the reference (see below) to the API
- Then a Javascript block allows you to specify the methods of calling the URL of the Dashboard (in the url variable). In this regard, you just have to change the URL of the code here with the one you got in the previous chapter.
- To finish the body of the file is simplified to its extreme, nevertheless 2 things are essential:
- The call to the opening (onload) of the function that initializes the API with the Dashboard
- The Dashboard container which is nothing other than a DIV tag
Step 2: Add interaction
Our Dashboard is now encapsulated in a page that is not managed by the solution Tableau . We will see how to add some buttons that will allow you to interact with the Dashboard from the page.
Let’s start with something simple and unidirectional and add the standard export and data visualization buttons like below:

Nothing could be simpler once again, for that we are going to add 3 javascripts functions which will make direct calls to the API:
<head>
    <title>Basic Embed</title>
    <!-- a utiliser dans Tableau Online -->
	<script src="https://online.tableau.com/javascripts/api/tableau-2.min.js"></script>
    <!-- a utiliser dans Tableau Public -->
	<!-- <script type="text/javascript" src="https://public.tableau.com/javascripts/api/tableau-2.min.js"></script> -->
    <script type="text/javascript">
        var viz,workbook, activeSheet;
		function initViz() {
			myurl="https://eu-west-1a.online.tableau.com/t/benoitcayla/views/2019_1_JO_v2_6/Rsultats?iframeSizedToWindow=true&:embed=y&:showAppBanner=false&:display_count=no&:showVizHome=no";
            var containerDiv = document.getElementById("vizContainer"),
                url = myurl,
                options = {
                    hideTabs: true,
					hideToolbar: true
                };
            viz = new tableau.Viz(containerDiv, url, options);
        }

		function exportPDF() {
			viz.showExportPDFDialog();
		}
		function exportImage() {
		  viz.showExportImageDialog();
		}
		function exportData() {
		  viz.showExportDataDialog();
		}
    </script>
</head>

<body onload="initViz();">
	<button onClick="exportPDF();">Export PDF</button>
	<button onClick="exportImage();">Export Image</button>
	<button onClick="exportData();">View data</button>
    <div id="vizContainer" style="width:800px; height:860px;"></div>
</body>

</html>
You also need to add the 3 buttons in the pure HTML code.
Step 3: Let’s add an external filter
The added buttons are very practical but do not act on the data itself. We are going to add two buttons that will allow you to add a filter on the data and remove it. For this we will use the method
activeSheet.getWorksheets().get("Nom de la Viz dans le TB").applyFilterAsync( "Nom du champ";, "Valeur du filtre", tableau.FilterUpdateType.REPLACE);</pre>

In the example above we add a button that filters on the city of London only. The next button cancels this filter.
Here is the code:
This should get you started in Embedded Analytic! Note that if – unlike this example – you use a Public Dashboard, you may have certain restrictions in terms of interactions.
<!DOCTYPE html>
<html>

<head>
    <title>Basic Embed</title>
    <!-- a utiliser dans Tableau Online -->
	<script src="https://online.tableau.com/javascripts/api/tableau-2.min.js"></script>
    <!-- a utiliser dans Tableau Public -->
	<!-- <script type="text/javascript" src="https://public.tableau.com/javascripts/api/tableau-2.min.js"></script> -->
    <script type="text/javascript">
        var viz,workbook, activeSheet;

		function initViz() {
			// Sur Tableau Public
			// myurl="https://public.tableau.com/shared/87NFGWSKK";
			// Sur Tableau Online
			myurl="https://eu-west-1a.online.tableau.com/t/benoitcayla/views/2019_1_JO_v2_6/Rsultats?iframeSizedToWindow=true&:embed=y&:showAppBanner=false&:display_count=no&:showVizHome=no";
            var containerDiv = document.getElementById("vizContainer"),
                url = myurl,
                options = {
                    hideTabs: true,
					hideToolbar: true,
                    onFirstInteractive: function () {
                        workbook = viz.getWorkbook() ;
						activeSheet = workbook.getActiveSheet() ;
                    }
                };
            viz = new tableau.Viz(containerDiv, url, options);
        }

		function FilterSingleValue() {
			activeSheet.getWorksheets().get("Par JO").applyFilterAsync(
				"Ville JO",
				"London",
				tableau.FilterUpdateType.REPLACE);
		}

		function clearFilter() {
			activeSheet.getWorksheets().get("Par JO").clearFilterAsync("Ville JO");
		}
		function exportPDF() {
			viz.showExportPDFDialog();
		}
		function exportImage() {
		  viz.showExportImageDialog();
		}
		function exportData() {
		  viz.showExportDataDialog();
		}

    </script>
</head>

<body onload="initViz();">
	<button onClick="FilterSingleValue();">London Only</button>
	<button onClick="clearFilter();">Clear filter</button>
	<button onClick="exportPDF();">Export PDF</button>
	<button onClick="exportImage();">Export Image</button>
	<button onClick="exportData();">View data</button>
    <div id="vizContainer" style="width:800px; height:860px;"></div>
</body>

</html>
As usual you can find the codes in Github .


I would like to call viz.showExportPDFDialog() and save the pdf file from server side, is there any callback exists?
Like this: viz.showExportPDFDialog().then(function(downloadLink){alert(downloadLink);});